

![]()
![]()
![]()
![]()
![]()
![]()
![]()
What are memory leaks?
Memory leaks are errors happening during the software development process, when requested system resources are not released after they are no longer needed.
The resulting consequences can be serious: A leaking application slows down over the course of time and, eventually, the whole system reacts in a sluggish manner. Applications do frequently crash in such a scenario.
Finding memory leaks with FindLeak
The following example shows how to find a memory leak with FindLeak. To be more specific, it shows a missing memory de-allocation after AllocSysString. Though it is only a simple memory leak example, it already shows how the powerful features of FindLeak can help you to track down memory related problems.
Note: Though not necessary for understanding this demonstration, we recommend downloading and installing FindLeak for following the steps listed below.
|
|
Start FindLeak. |
|
|
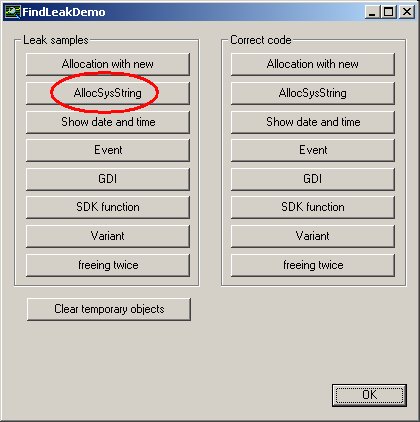
Start the application to be examined, FindLeakDemo in this case. (It is included with the FindLeak demo download.) Within this sample application click the button "AllocSysString" (on the left side in the category "Leak samples"). Clicking this button executes source code for allocating a string, but never releases the memory. |
|
|
|
|
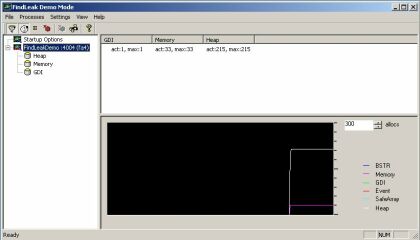
FindLeak should already list the FindLeakDemo application. After expanding the tree view on the left side (by clicking on the "+" symbol) the currently allocated memory resources for heap, memory, and GDI objects can be seen in the list view on the right hand side. |
|
|
|
|
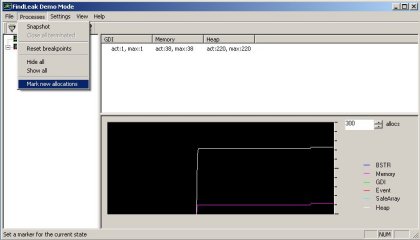
Right-click on the "FindLeak Demo" entry to pop up the context menu. Select "Mark new allocations" in order to visualize further memory allocations. |
|
|
|
|
Re-execute the incorrect code by clicking the FindLeakDemo's "AllocSysString" button for another time. |
|
|
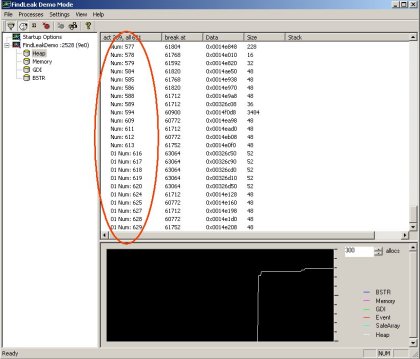
Switch back to FindLeak and expand the tree view's "FindLeakDemo" entry. Select "Heap" to see newly added entries in the list view on the right hand side, beginning with the prefix "01". These entries represent memory locations that were allocated during the second "AllocSysString" pass. |
 |
|
|
|
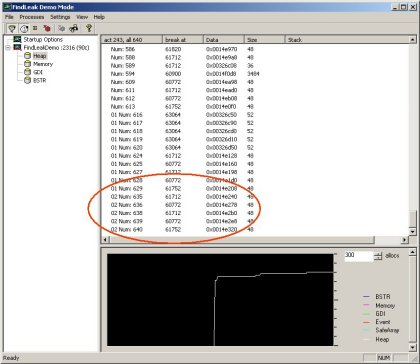
Re-iterate the last three steps in order to demonstrate further memory allocations. With each pass, new entries appear in the list view, marked with the prefix "02", "03", and so on. |
|
|
|
|
|
|
|
With each pass you can see a certain quantity of memory being allocated, but never being released. Furthermore, the corresponding value in the "break point" column remains the same over several iterations. This indicates that the memory allocation happens in a particular part of the source code. |
|
|
|
|
|
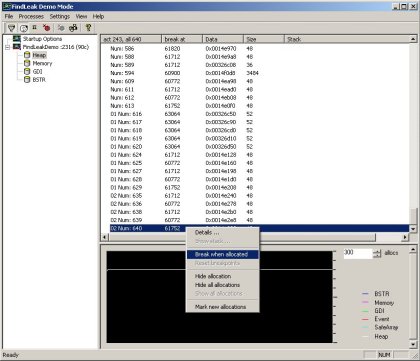
You can tag the corresponding source code for inspection by setting a break point. To do this, select one of the entries referring to the indicated leak and select "Break when allocated" in the context menu. |
|
|
|
|
|
|
|
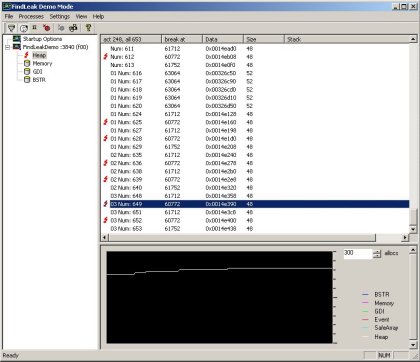
After having selected "Break when allocated", the tree view's "Heap" node shows a red flash, representing a break point. Also, each entry in the list view referring to selected memory location shows a red flash, too. |
|
|
|
|
|
|
|
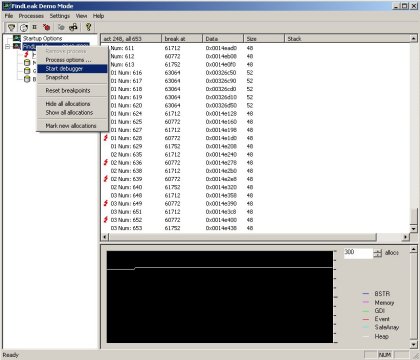
Right-click on "FindLeak Demo" in FindLeak's tree view and select "Start debugger" to invoke your development environment's debugger. |
|
|
|
|
Clicking "AllocSysString" for another time will now halt "FindLeak Demo" at the marked position. With this it is possible for you to analyze FindLeak Demo's source code at the critical position. |
|
|
As you have seen, locating memory leaks with FindLeak is a quick and simple task. If you would like to learn more about using FindLeak (we sure hope so :-), feel free to download the FindLeak demo version. It contains, amongst other things, the sample project discussed above. |
Home | Download Demo | FAQ | Order FindLeak | Legal Terms | Imprint
Responsible for the content of this web site:
cjt Systemsoftware AG.
Copyright © 2003 cjt Systemsoftware AG. All rights reserved